
Time of concentration calculator units: ft=foot, km=kilometer, m=meter, min=minute, s=second.
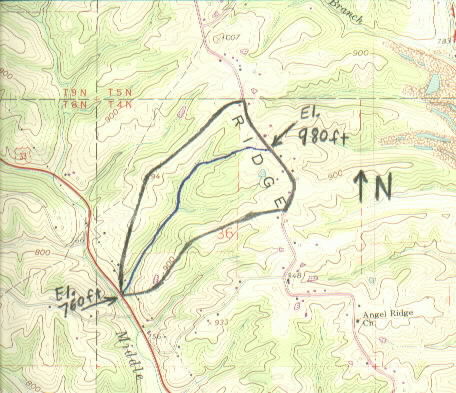
Fig. 1. Sample Watershed.
Heavy black line indicates watershed boundary
Heavy blue line indicates longest watercourse.
Length of longest watercourse = 4500 ft. (curvy length)
Slope of longest watercourse = (980-760) ft / 4500 ft = 0.0489 ft/ft = 0.0489 m/m
Average slope of watershed: See SUDAS (2013).
Introduction
Time of concentration is a fundamental watershed parameter. It is used to compute the peak
discharge for a watershed. The peak discharge is a function of the rainfall intensity,
which is based on the time of concentration. Time of concentration is the longest time
required for a particle to travel from the watershed divide to the watershed outlet. Each
of the four equations used in our time of concentration calculation require inputs for
the longest watercourse length in the watershed (L), the average slope of that watercourse
(S), and a coefficient representing the type of ground cover. Usually L and S can be
obtained from topographic maps as in Fig. 1 above. The coefficient is determined from
photographs of the watershed or field reconnaissance. Our calculation computes the time of
concentration, average velocity, and lag time for the watershed. A variety of units may be
selected.
The time of concentration calculator uses the FAA, Kirpich, Kerby, and NRCS equations. The FAA (U.S.
Federal Aviation Administration) equation is the most commonly used of the three because
it uses the widely recognized Rational runoff coefficient (c) to describe watershed ground cover. The Rational coefficient is used in the Rational Equation Peak Discharge Method Another widely used equation is the National Resource Conservation Service (NRCS) equation. It is common because it utilizes the curve number (CN) which is identical to the curve number used in the NRCS (formerly Soil Conservation Service) TR-55 peak discharge method.
The Kirpich equation,
developed in 1940, is the oldest of the three equations and is probably the most widely
recognized, but no longer the most commonly used. The Kerby equation is the least common
of the three equations and has the most limitations. Please see the section below for
applicability of the equations. There are other equations for time of concentration, but
most of them require rainfall intensity as an input. Thus, using those other equations to
determine the rainfall intensity for computing peak discharge results in an iterative
process because the rainfall intensity itself is a function of the time of concentration.
Equations
The following equations are used for the time of concentration calculation. All of the equations shown below use
the English units indicated in the Variables section. Of course, our calculation uses a
variety of units with all of the unit conversions handled internally by the program. The
equations can be found in Chin (2000), Chow et al. (1988), Corbitt (1999), Roussel (2005), Singh
(1992), and NRCS (2021). Some of the equations use S as slope of the longest watercourse while others use S as the average watershed slope. For two of the four methods, the references are contradictory regarding which slope to use.
FAA equation: t = G (1.1 - c) L0.5 / (100 S)1/3 where S is watercourse slope (Corbitt, Chow).
Kirpich equation: t = G k (L / S0.5) 0.77 where S is watercourse slope (Chin, Singh) or watershed slope (Chow, Roussel).
Kerby equation: t = G (L r / S0.5) 0.467 where S is watercourse slope (Roussel) or watershed slope (Chin).
NRCS equation: t = (60)(L0.8) (1000/CN - 9)0.7 / [(1140)(100S)0.5] where S is watershed slope (all references).
Recommendations
The FAA method was developed from data obtained from airport runoff but has been
successfully applied to overland flow in urban areas. If you are using the Rational Equation to compute peak discharge, use the FAA method for time of concentration.
The NRCS method is recommended if you are using the TR-55 peak discharge method. It is suggested for drainage areas of 1 to 2000 acres in the U.S., Puerto Rico, the U.S. Virgin Islands, and selected Pacific Islands (NRCS, 2021) yet the method is used in other locations as well.
The Kirpich equation was developed from data obtained in seven rural watersheds in
Tennessee (USA). The watersheds had well-defined channels and steep slopes of 0.03 to 0.1
ft/ft (3 to 10%) and areas of 1 to 112 acres. It is used widely in urban areas for both
overland flow and channel flow; and it is used for agricultural watersheds up to 200 acres
(80 hectares).
The Kerby equation was developed from data obtained in watersheds having watercourses less
than 1200 ft. (365 m), slopes less than 0.01 ft/ft (1%), and areas less than 10 acres (4
hectares).
The NRCS method is recommended for 1-2000 acres (NRCS) but is commonly used for much larger watersheds where the watershed is split into subwatersheds.
Variables
The units refer to the units that must be used in the equations shown above.
However, a variety of units may be used in our calculation. Lag time is a parameter seen in the NRCS methodology.
c = Rational method runoff coefficient. See Table of Coefficients below.
CN = NRCS curve number. See table below.
G = Constant. FAA: G=1.8, Kirpich: G=0.0078, Kerby: G=0.8268
k = Kirpich adjustment factor. See Table of Coefficients below.
L = Longest watercourse length in the watershed, ft.
r = Kerby retardance roughness coefficient. See Table of Coefficients below.
S = Slope of longest watercourse or average watershed slope (see recommendations above), ft/ft or m/m.
Tc = Time of concentration, minutes.
V = Average velocity in watercourse, ft/min. V=L/Tc.
Tlag = Lag time, minutes. Tlag=0.6 Tc. In simple terms, this is the time at which peak flow occurs.
Table of Coefficients
| Ground Cover | Rational Runoff Coefficient for FAA Method, c (Corbitt, 1999; Singh, 1992) | |||
| Lawns | 0.05 - 0.35 | |||
| Forest | 0.05 - 0.25 | |||
| Cultivated land | 0.08-0.41 | |||
| Meadow | 0.1 - 0.5 | |||
| Parks, cemeteries | 0.1 - 0.25 | |||
| Unimproved areas | 0.1 - 0.3 | |||
| Pasture | 0.12 - 0.62 | |||
| Residential areas | 0.3 - 0.75 | |||
| Business areas | 0.5 - 0.95 | |||
| Industrial areas | 0.5 - 0.9 | |||
| Asphalt streets | 0.7 - 0.95 | |||
| Brick streets | 0.7 - 0.85 | |||
| Roofs | 0.75 - 0.95 | |||
| Concrete streets | 0.7 - 0.95 | |||
| Ground Cover | Kirpich Adjustment Factor, k (Chow et al., 1988; Chin, 2000) | |||
| General overland flow and natural grass channels | 2.0 | |||
| Overland flow on bare soil or roadside ditches | 1.0 | |||
| Overland flow on concrete or asphalt surfaces | 0.4 | |||
| Flow in concrete channels | 0.2 | |||
| Ground Cover | Kerby Retardance Coefficient, r (Chin, 2000) | |||
| Conifer timberland, dense grass | 0.80 | |||
| Deciduous timberland | 0.60 | |||
| Average grass | 0.40 | |||
| Poor grass, bare sod | 0.30 | |||
| Smooth bare packed soil, free of stones | 0.10 | |||
| Smooth pavements | 0.02 | |||
| Description of Land Use | NRCS Curve Number (CN) for Hydrologic Soil Groups A-D (NRCS, 2021) | |||
| A | B | C | D | |
| Paved parking lots, roofs, driveways | 98 | 98 | 98 | 98 |
| Streets and Roads: | ||||
| Paved with curbs and storm sewers | 98 | 98 | 98 | 98 |
| Gravel | 76 | 85 | 89 | 91 |
| Dirt | 72 | 82 | 87 | 89 |
| Cultivated (Agricultural Crop) Land: | ||||
| Without conservation treatment (no terraces) | 72 | 81 | 88 | 91 |
| With conservation treatment (terraces, contours) | 62 | 71 | 78 | 81 |
| Pasture or Range Land: | ||||
| Poor (<50% ground cover or heavily grazed) | 68 | 79 | 86 | 89 |
| Good (50-75% ground cover; not heavily grazed) | 39 | 61 | 74 | 80 |
| Meadow (grass, no grazing, mowed for hay) | 30 | 58 | 71 | 78 |
| Brush (good, >75% ground cover) | 30 | 48 | 65 | 73 |
| Woods and Forests: | ||||
| Poor (small trees/brush destroyed by over-grazing or burning) | 45 | 66 | 77 | 83 |
| Fair (grazing but not burned; some brush) | 36 | 60 | 73 | 79 |
| Good (no grazing; brush covers ground) | 30 | 55 | 70 | 77 |
| Open Spaces (lawns, parks, golf courses, cemeteries, etc.): | ||||
| Fair (grass covers 50-75% of area) | 49 | 69 | 79 | 84 |
| Good (grass covers >75% of area) | 39 | 61 | 74 | 80 |
| Commercial and Business Districts (85% impervious) | 89 | 92 | 94 | 95 |
| Industrial Districts (72% impervious) | 81 | 88 | 91 | 93 |
| Residential Areas: | ||||
| 1/8 Acre lots, about 65% impervious | 77 | 85 | 90 | 92 |
| 1/4 Acre lots, about 38% impervious | 61 | 75 | 83 | 87 |
| 1/2 Acre lots, about 25% impervious | 54 | 70 | 80 | 85 |
| 1 Acre lots, about 20% impervious | 51 | 68 | 79 | 84 |
The hydrologic soil group refers to the infiltration potential of the soil after prolonged wetting.
Group A Soils: High infiltration (low runoff). Sand, loamy sand, or sandy loam. Infiltration rate > 0.3 inch/hr when wet.
Group B Soils: Moderate infiltration (moderate runoff). Silt loam or loam. Infiltration rate 0.15 to 0.3 inch/hr when wet.
Group C Soils: Low infiltration (moderate to high runoff). Sandy clay loam. Infiltration rate 0.05 to 0.15 inch/hr when wet.
Group D Soils: Very low infiltration (high runoff). Clay loam, silty clay loam, sandy clay, silty clay, or clay. Infiltration rate 0 to 0.05 inch/hr when wet.
Error Messages given by calculation
"Need S>0", "Need L>0". Initial input checks.
Slope and Length must be positive numbers.
"Need 0<c≤1 for FAA". c must be in this range for the FAA equation.
"Need k>0 for Kirpich", "Need r>0 for Kerby", "Need 0<CN≤100 for NRCS". Input checks.
References
Chin, David A. 2000. Water-Resources Engineering. Prentice-Hall.
Chow, Ven Te, David R. Maidment, and Larry W. Mays. 1988. Applied Hydrology. McGraw-Hill.
Corbitt, Robert A. 1999. Standard Handbook of Environmental Engineering. McGraw-Hill. 2ed.
Roussel, M. C., Thompson, D. B., Fang, X., Cleveland, T. G., and Garcia, C. A. 2025, Aug. Time-Parameter Estimation for Applicable Texas Watersheds. Lamar University. Texas Department of Transportation. https://library.ctr.utexas.edu/digitized/texasarchive/phase2/4696-2-lamar.pdf
National Resources Conservation Service. 2021, Feb. Part 650 Engineering Field Handbook. National Engineering Handbook. Chapter 2: Estimating runoff volume and peak discharge. https://directives.nrcs.usda.gov/sites/default/files2/1712930818/31754.pdf
Singh, Vijay P. 1992. Elementary Hydrology. Prentice-Hall.
Statewide Urban Design and Specifications [SUDAS]. 2013. Design Manual, Chapter 2: Stormwater, Urban Hydrology and Runoff. https://www.intrans.iastate.edu/wp-content/uploads/sites/15/2020/03/2B-3.pdf
© 2003-2026 LMNO Engineering, Research, and Software, Ltd. (All Rights Reserved)
LMNO Engineering, Research, and Software, Ltd.
7860 Angel Ridge Rd. Athens, Ohio 45701 USA Phone: (740) 707-2614
LMNO@LMNOeng.com
https://www.LMNOeng.com
Added NRCS Time of Concentration Method Februrary 3, 3026.